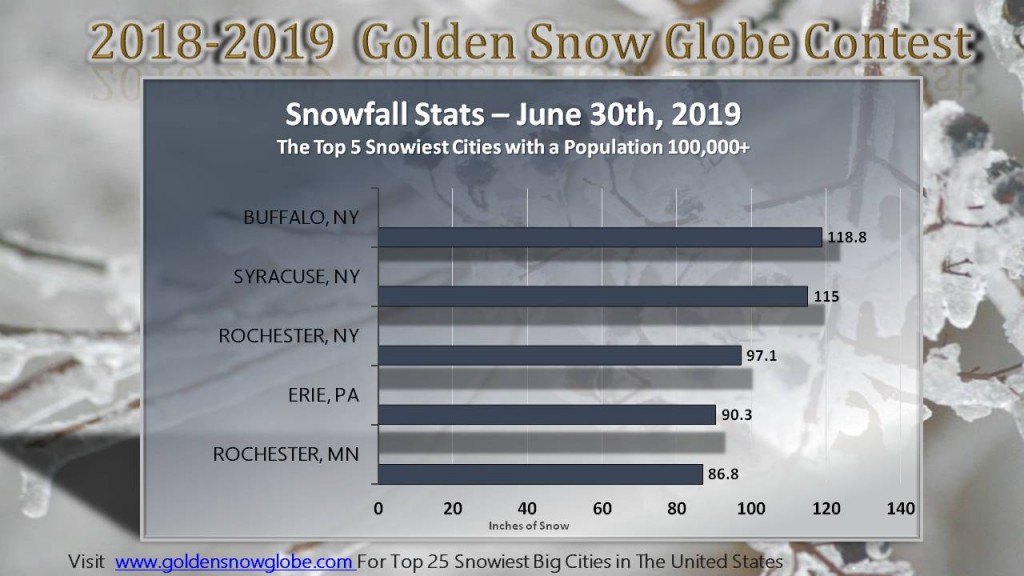
Congratulations Buffalo, NY – Projected 2 Time Winners of The National and New York Snow Contest
I know, it’s about time I called the National Golden Snow Globe contest. Buffalo also won the New York Golden Snowball contest for the 2021-2022 snow season. I was a little hesitant to call this after last season when Lakewood, Colorado came from 40+ inches down going into March and Came back to win the contest last season. It is still snowing in parts of Colorado as I type this which is why I have Buffalo as the Projected winners ![]() It’s also 93 degrees right now as I type this. If you know me you know this fat man does not like Hot even a little bit
It’s also 93 degrees right now as I type this. If you know me you know this fat man does not like Hot even a little bit ![]()
Keep in mind that the official snow season doesn’t end until June 30th and any changes will be updated. Have a Great Summer All! If you enjoyed the contest this season, feel free to click the donate button and Thanks 
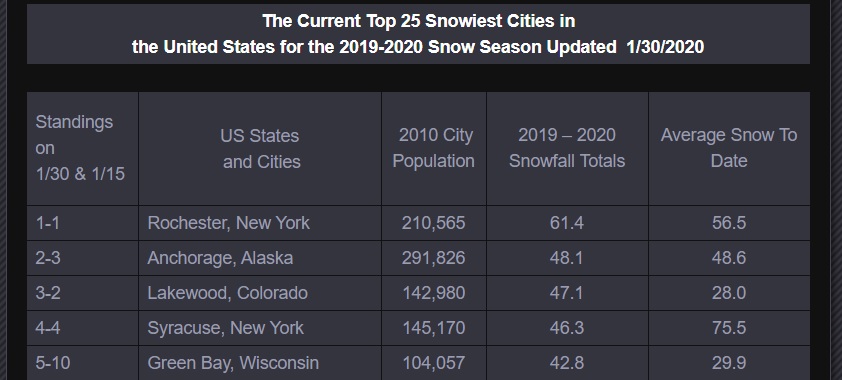
The Top 25 Snowiest Cities in The United States (Cities w/population of 100,000 or more 2010 census)
|
GOLDENSNOWGLOBE.COM – The |
| Standings on 6/1/2022 |
and Cities |
2010 City |
2021 – 2022 |
Average Season |
| 1 | Buffalo, New York |
261,310 |
97.4 |
95.4 |
| 2 | Anchorage, Alaska |
291,826 |
89.3 |
77.9 |
| 3-NEW – This Season |
Boulder, Colorado |
108,250 |
88.7 |
91.8 |
| 4 | Rochester, New York |
210,565 |
87.0 |
102.0 |
| 5 | Syracuse, New York |
145,170 |
76.0 |
127.8 |
| 6 | Grand Rapids, Michigan |
188,040 |
71.0 |
77.6 |
| 7 | Billings, Montana |
104,170 |
62.8 |
57.4 |
| 8 | Erie, Pennsylvania |
101,786 |
61.4 |
104.3 |
| 9 | Flint, Michigan |
102,434 |
60.5 |
52.1 |
| 10 | Lansing, Michigan |
114,297 |
58.1 |
50.2 |
| 11 | Ann Arbor, Michigan |
113,934 |
56.8 |
61.4 |
| 12 | Fargo, North Dakota |
105,549 |
56.2 |
51.4 |
| 13 | South Bend, Indiana |
101.168 |
56.0 |
64.5 |
| 14 | Boston, Mass |
617,594 |
54.0 |
49.2 |
| 15 | Worcester, Mass |
181,045 |
53.6 |
72.9 |
| 16 | Cleveland, Ohio |
396,815 |
53.0 |
63.8 |
| 17 | Akron, Ohio |
199,110 |
52.0 |
47.2 |
| 18 | Minneapolis, Minnesota |
382,578 |
50.2 |
51.2 |
| 19 | Denver, Colorado |
600,158 |
49.4 |
??? |
| 20 Last Seasons Champs |
Lakewood, Colorado |
142,980 |
48.2 |
57.7 |
| 21 | Detroit, Michigan |
713,777 |
47.1 |
45.0 |
| 22 |
Pittsburgh, Pa * |
305,704 |
44.8 |
44.1 |
| 23 | Fort Collins, Colorado |
143,986 |
44.1 |
50.7 |
| 24 | Green Bay, Wisconsin |
104,057 |
43.8 |
55.6 |
| 25 | Providence, Rhode Island |
178,042 |
43.5 |
36.6 |
Some of The Other
Snowy
Cities in The United States (POP -100,000+ as off 2010)
| 26 | Manchester, New Hampshire |
109,565 |
41.8 |
??? |
| 27 | Salt Lake City, Utah |
186,440 |
38.8 |
51.9 |
| 28 | Spokane, Washington |
208,916 |
38.8 |
45.4 |
| 29 | Des Moines, Iowa |
203,433 |
36.0 |
36.5 |
| 30 | Colorado Springs, Colorado |
416,427 |
33.4 |
32.5 |
| 31 | Chicago, Illinois |
2,695,598 |
32.8 |
38.4 |
| 32 | Hartford, Connecticut |
124,775 |
31.5 |
51.7 |
| 33 | Peoria, Illinois |
115,007 |
31.5 |
26.2 |
| 34 | Madison, Wisconsin |
233,209 |
31.3 |
51.8 |
| 35 | Toledo, Ohio |
287,208 |
30.8 |
37.4 |
| 36 | Rochester, Minnesota |
106,769 |
30.3 |
53.1 |
| 37 | Provo, Utah |
112,488 |
30.0 |
44.9 |
| 38 | Milwaukee, Wisconsin |
594,833 |
28.7 |
48.7 |
| 39 |
Lowell, MA |
106,519 |
28.0 |
??? |
| 40 | Bridgeport, Connecticut |
144,229 |
27.7 |
33.6 |
| 41 | Pueblo, Colorado* |
106,595 |
25.8 |
28.3 |
| 42 | New York, New York (Laguardia)* |
8,175,133 |
25.3 |
29.8 |
| 43 | Springfield, Illinois |
116,250 |
24.6 |
21.8 |
| 44 | Lexington, Kentucky |
295,803* |
23.9 |
14.5 |
| 45 | Fort Wayne, Indiana |
253,691 |
23.2 |
33.6 |
| 46 | Boise, Idaho |
205,671 |
22.0 |
17.6 |
| 47 | Rockford, Illinois |
152,871 |
21.9 |
37.1 |
| 48 | Topeka, Kansas |
127,473 |
21.1 |
17.1 |
| 49 | Joliet, Illinois* |
147,433 |
20.6 |
16.9 |
| 50 | Sioux Falls, South Dakota |
153,888 |
19.9 |
45.3 |
| 51 | Kansas City, Missouri |
459,787 |
19.7 |
18.2 |
| 52 | Allentown, Pennsylvania * |
118,032 |
19.5 |
33.1 |
| 53 | Newark, New Jersey* |
277,140 |
17.9 |
31.5 |
| 54 | Springfield, Missouri* |
159,498 |
17.0 |
??? |
| 55 | Wichita, Kansas |
382,368 |
16.8 |
12.7 |
| 56 | Dayton, Ohio |
141,527 |
16.5 |
25.0 |
| 57 | Amarillo, Texas* |
190,695 |
16.1 |
17.2 |
| 58 | Columbus, Ohio |
787,033 |
14.5 |
28.2 |
| 59 | Baltimore, Maryland |
620,961 |
14.4 |
19.3 |
| 60 | Reno, Nevada |
225,221 |
13.4 |
20.9 |
| 61 | Cincinnati, Ohio |
296,943 |
13.3 |
23.3 |
| 62 |
Washington DC (National)* |
601,723 |
13.2 |
13.7 |
| 63 | Philadelphia, Pa |
1,526,006 |
12.9 |
23.1 |
| 64 | Nashville, Tennessee |
644,014* |
12.3 |
0 |
| 65 | St. Louis, Missouri* |
319,365 |
12.1 |
16.6 |
| 66 | Norfolk, Virginia* |
242,803 |
11.2 |
??? |
| 67 | Indianapolis, Indiana |
820,445 |
11.0 |
25.5 |
| 68 | Oklahoma City, OK* |
579,999 |
11.0 |
6.7 |
| 69 | Omaha, Nebraska |
408,958 |
10.8 |
27.1 |
| 70 | Knoxville, Tennessee |
178,874 |
10.7 |
4.6 |
| 71 | Eugene, Oregon* |
583,776 |
10.1 |
??? |
| 72 | Louisville, Kentucky* |
597,337* |
9.5 |
13.4 |
| 73 | Albuquerque, New Mexico |
545,852 |
9.4 |
7.9 |
| 74 | Seattle, WA* |
608,660 |
9.2 |
??? |
| 75 | Greensboro, NC* |
269,666 |
8.2 |
7.1 |
| 76 | Portland, Oregon* |
583,776 |
6.3 |
??? |
| 77 | Little Rock, Arkansas * |
193,524 |
6.0 |
3.8 |
| 78 | Lincoln, Nebraska? |
258,379 |
5.1 |
26.0 |
| 79 | Richmond, Virginia |
210.309 |
4.7 |
??? |
| 80 | Charlotte, NC* |
731,424 |
4.3 |
3.5 |
| 81 | El Paso, Texas |
649,121 |
3.5 |
2.8 |
| 82 | Abilene, Texas* |
117,063 |
3.0 |
3.7 |
| 83 | Raleigh, NC* |
403,829 |
2.7 |
5.2 |
| 84 | Lubbock, Texas* |
229,573 |
2.7 |
7.0 |
| 85 | Midland, Texas |
111,147 |
1.1 |
4.3 |
| 86 | Birmingham , Alabama |
212,237 |
0.8 |
1.4 |
| 87 | Atlanta, Georgia |
420,003 |
0.5 |
2.2 |
| 88 | Austin (BERGSTROM), Texas |
790,390 |
0.2 |
0.2 |
| 89 | Jackson, Mississippi* |
173,514 |
Trace |
0.6 |
| 90 | Independence, Missouri |
116,830 |
0.0??? |
13.2 |
| 91 | San Antonio, Texas |
1,327,407 |
0.0 |
0.2 |
| 92 | Houston, Texas |
2,099,451 |
0.0 |
0.0 |
| 93 | Corpus Christi, Texas |
305,215 |
0.0 |
0.2 |


